Taiwan
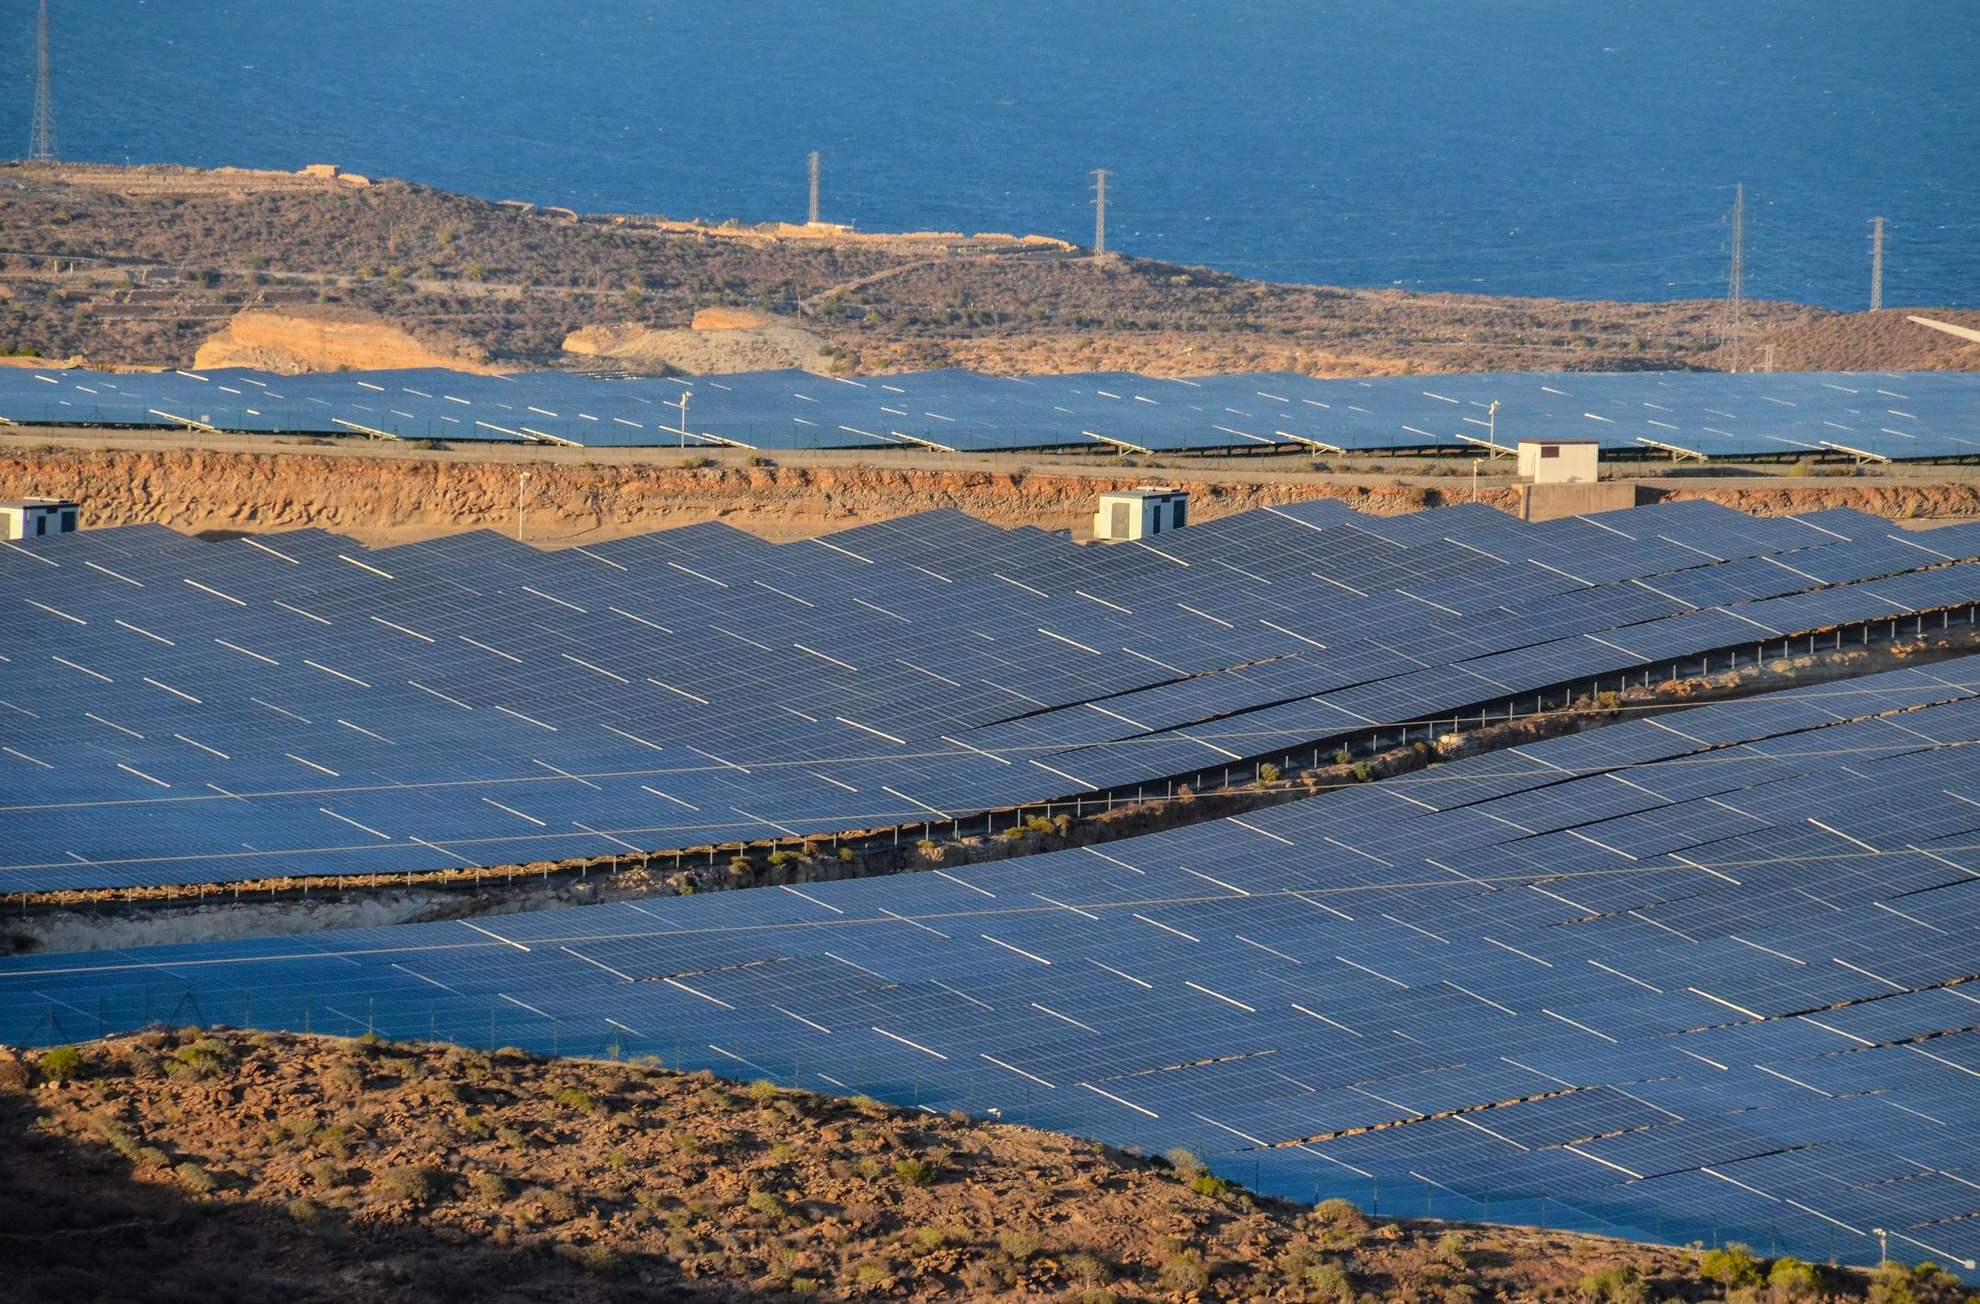
Taiwan — Budai, Chiayi Renewable Infrastructure
Solar & Fishery Hybrid • 150.00 MW capacity • Monthly distributions
IRR
14.5%
Dividend Yield
7.7%
Appreciation
6.8%
Next distribution
Jul 26, 2026
View project details
Performance Breakdown
12-month trend